STONE AGE CRATHES
Uncovering one of the largest Mesolithic Sites in the UK
METHODS

Field-walking was carried out after ploughing and after the soil had been weathered.
The
soil
does
need
to
be
‘weathered’.
Heavy
rain
exposes
the
flints
by
washing
away
finer-grained
material. The flints also show up better if they are wet.
Walking
a
newly
ploughed
field
may
show
little
or
no
lithic
material,
and
could
give
a
very
wrong
assessment. We know this from experience.
Notes made by Roger Daly on John Grieve’s collections mention that he fieldwalked after heavy rain.
Use of hand-held GPS
During
fieldwalking
with
OFARS
at
Kinclune,
James
Kenworthy
introduced
us
to
the
use
of
hand-held
GPS
for
recording
the
grid
reference
of
each
find.
This
method
was
initiated
by
him
in
2003
at
Gory
Hill,
and
we
employed
the
same method at Crathes.
As
the
scatters
were
quite
intensive
over
large
parts
of
the
area
we
found
it
more
efficient
for
each
person
to
have
their
own
GPS,
although
this
was
not
always
possible.
The
different
GPSs
were
accurate
to
2-3m
and
correlated
well.
Grid
references
were
taken
along
the
edges
of
all
the
fields
walked.
I
also
took
GRs
along
the
higher
and
lower
areas
of
NM
3
in
an
attempt
to
give
an
approximation of possible river braiding.
We
think
using
hand-held
GPS
is
a
very
effective
and
simple
fieldwalking
method
for
showing
the
spread
and
intensity
of
flint
scatters
in
plough-soil
and
therefore
to
be
recommended
and
ideal
for
amateurs.
Vicki
Cummings
(2010)
used
hand-held
GPS
in
a
similar
manner
to
us
and
also
advocates
this
method.
The
grid
references
could
then
be
used
to
compile
10m
x
10m
squares
and
calculate
the
total
number
of
lithics
in
each square.
Recording
I
used
Microsoft
Excel
for
the
cataloguing
and
recording
of
attributes,
the
lithics
scatterplots
and
concentration
charts.
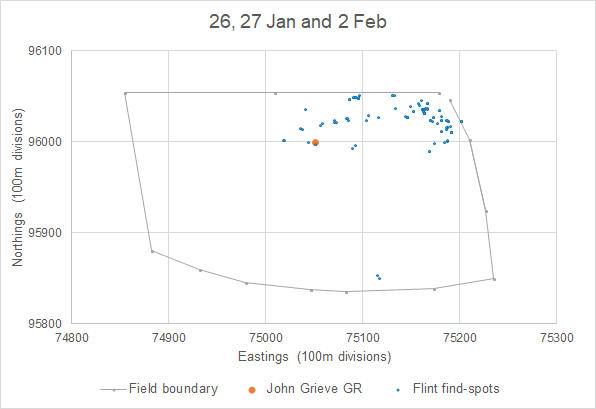
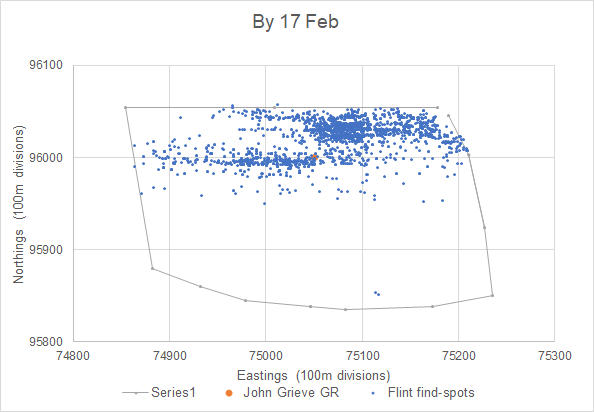
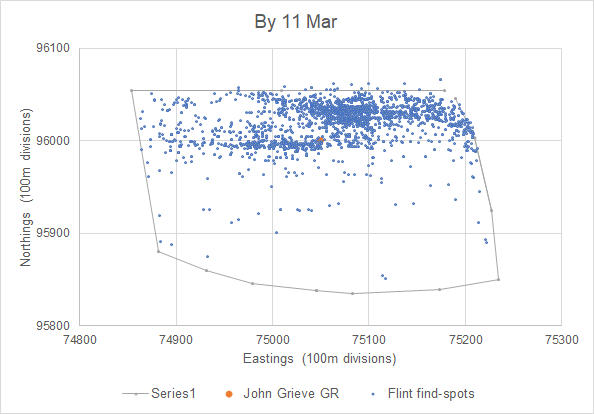
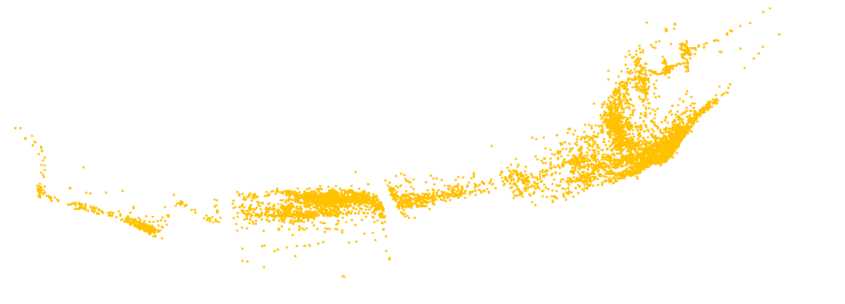
Scatterplots
The
scatterplots,
using
the
Excel
‘Scatter
chart’,
were
compiled
directly
from
the
grid
references
(y
axis:
Northings;
x
axis;
Eastings).
This
is
very
quick
and
useful
method
for
indicating
the
spread
over
the
area
covered.
However,
this
does
not
give
an
accurate
representation
of
numbers,
as
finds
with
the
same
grid
reference will show as only one 'find-point' on the chart.
It
can
also
be
used
for
more
specific
tasks
such
as
showing
the
locations
of
cores
(for
example)
over
the
area,
or even finds from 1 person's 'walk' on a particular day.
Concentration charts
The
concentration
charts
were
plotted
as
the
number
of
flints
per
10m
x
10m
square,
as
we
felt
this
gave
us
a
good picture of the area taking into account the accuracy of the GPS and the fact that the flints were not
in situ
.
The
totals
per
square
were
calculated
by
summing
the
numbers
of
lithics
found
at
each
relevant
grid
reference.
Comparison of scatterplots and concentration charts
As
mentioned
above,
the
scatterplots
do
not
give
an
accurate
representation
of
numbers,
whereas
the
concentration
charts
represent
the
actual
numbers
found
per
10mx10m
square.
The
more
intense
the
scatter,
the more the discrepancy increases (see the figure below).


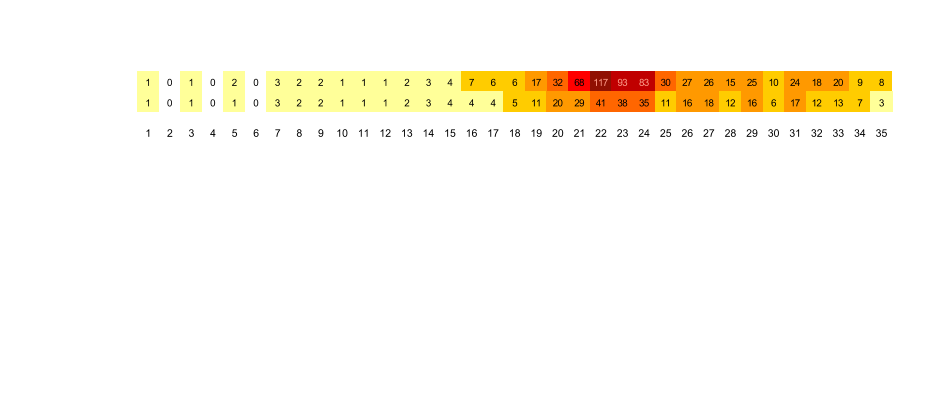


Figure The total number of flints and the number of grid references per each 10mx10m square
along a transect from NM 1, 2008: Northings 96 (check) and Eastings 75860 - 75209.
Table: Brief summary of fields and areas walked

Field

Year

At 2m apart

>2m apart

MC

2008

Preliminary: W and S edges


MC

2011

W and S edges, extending further into the field

Some line walking in rest of field

NM 1

2008

N half of field, including terrace

S half of field

NM 1

2012

Part of intensive area in N half of field


NM 2

2008


Brief survey along the terrace; unweathered soil

NM 2

2010

Most of the terrace and adjacent area

N bank, ridge and part of S half of the field

NM 2

2011

Terrace and adjacent areas including N bank

N and S parts of the field
NM 2
2012
Brief walk through East end of terrace
NM 3
2009
All the field except N end and extreme S edge
N end of field
NM 4
2009
S W corner, W edge, and narrow strip along S
edge; also part near NW corner
Some very brief line walking over rest of field
NM 5
2009
Very brief survey round edges and across diagonal
Areas walked
Fieldwalking
in
the
1980s
had
given
us
some
idea
of
scatter
locations;
some
line-walking
to
and
from
the
strips
to
be
investigated
systematically
added
to
this
information.
Walking
at
2m
apart
was
mainly
focussed
on
the
terrace
and
adjacent
areas.
Other
areas
were
covered
less
intensively.
The
table
below
gives
an
indication
of
the
areas
walked
during
the
five
year
survey.
Details
of
the
areas
investigated
are
included
with
the
relevant
concentration charts, and a diary of of the fieldwalking with numbers of flints
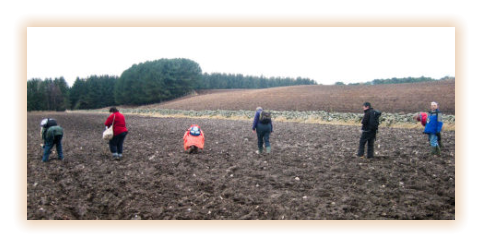
OFARS
members
field-walking
in
NM
1
along
the
middle
terrace;
the
bank
of
the
upper
terrace
is
the
other
side
of
the
wall
(top right) in NM 1A
Fieldwalking methods
Systematic
fieldwalking
is
recommended
to
enable
comparisons
to
be
made
with
other
collections.
Various
method can be used, such as line walking, measured areas, total collection.
We
opted
for
total
collection,
following
James’
procedure
using
hand-held
GPS,
and
walking
2m
apart
using
furrows
as
guidelines
wherever
possible.
Each
flint
was
individually
bagged
and,
to
save
time,
labelled
with
just
the
GR
co-ordinates
and
finder's
initials
and
kept
by
the
finder.
Where
flints
were
within
1m
of
each
other
they
were
put
into
the
same
bag.
Afterwards,
at
the
end
of
each
session,
finders
were
each
allocated
a
larger bag, labelled with the date, site, field number and his/her initials to contain their finds.
Later,
I
rinsed
the
finds
(many
were
muddy),
briefly
looked
at
them,
and
replaced
them
in
their
bags,
transferring
any
‘extras’
to
their
own
individual
bags.
All
the
relevant
information
(i.e.
site,
field
no.,
GR,
date
and finder’s initials) was added to each bag where necessary.
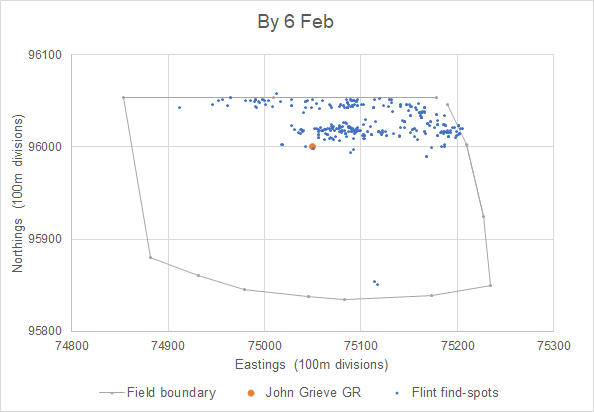
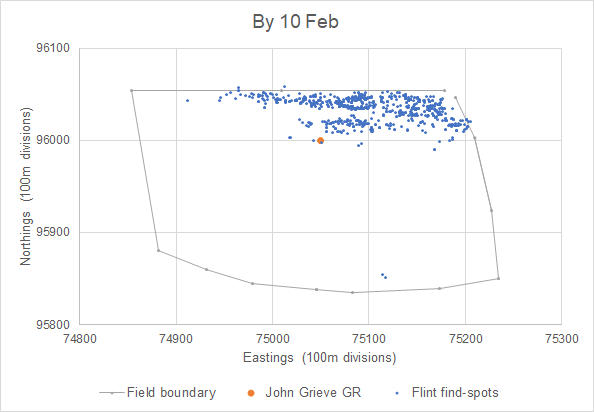
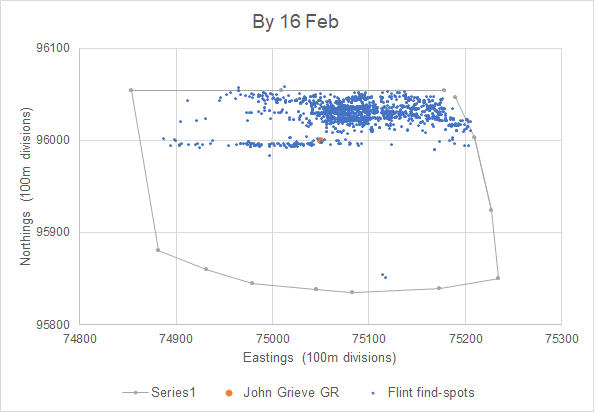
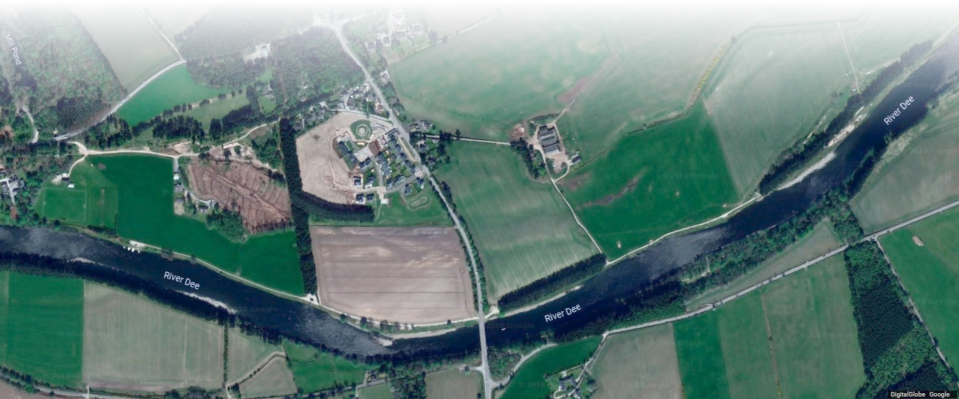
FIELDWALKING
Photo: P Fawcett
Select the buttons below to view the fieldwalking progression through NM 1


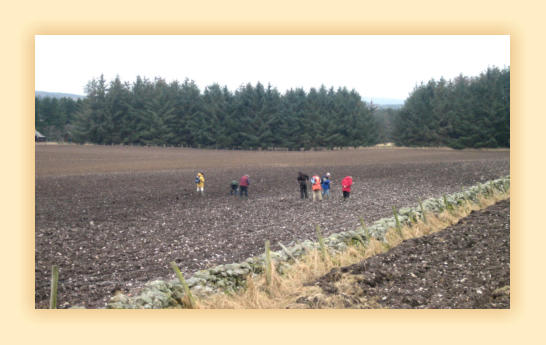
NM 1, with NM 1A bottom right. Photo: P Fawcett

NB Typing error: the top left grid reference should of course be 748.
Reference
Vicki
Cummings
(2010)
A
view
from
the
outside:
some
thoughts
on
the
research
priorities
for
Mesolithic
and
Neolithic
studies
in
Britain
and
Ireland
(Methodologies).
‘LIthics,
Journal
of
the
Lithic
Studies
Society
Volume
32
page 72.