STONE AGE CRATHES
Uncovering one of the largest Mesolithic Sites in the UK
LITHIC CONCENTRATION CHARTS
The Lithic Concentration Charts giving the exact numbers of flints per 10m x 10m squares were compiled by
counting the total number of flints at each relevant grid reference. The colour key for all the concentration
charts is as below.
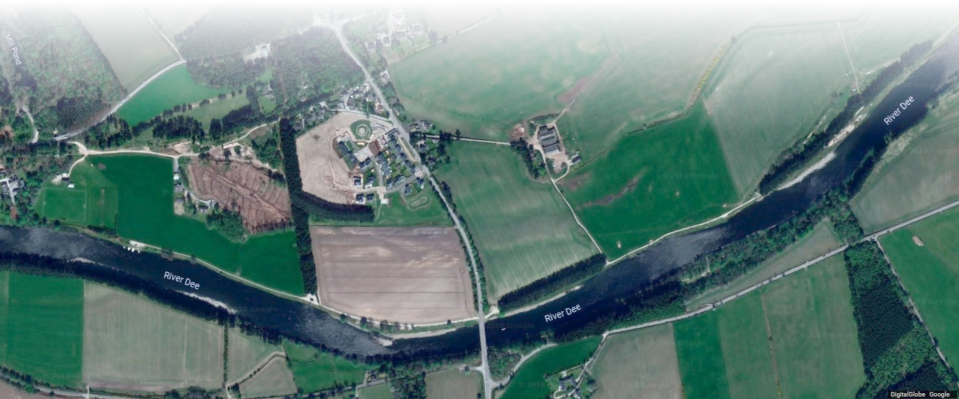
The five fields of the Crathes site
COLOUR KEY: Number of lithics per 10m x 10m square

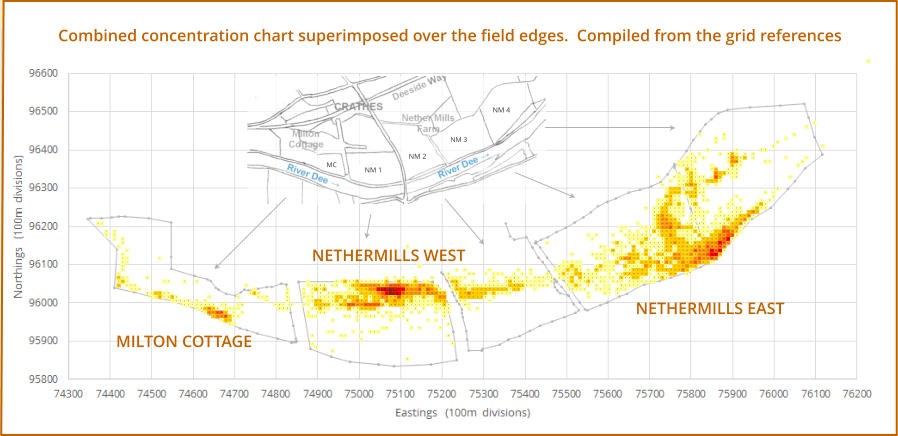
The concentration chart of the the five Crathes fields .
The data are from: MIlton Cottage, CR 2011; NM 1, CR 2008; NM 2, 2011: NM 3 and 4, 2009.
Almost
all
the
3000+
flints
were
found
in
the
N
part
of
the
field,
an
area
approximately
350m
x
100m,
along
the
middle
terrace
(Terrace
Site)
and
the
'island'
(Island
Site).
A
few
were
collected
from
the
south
edge
of
NM
1A
at
the base of the bank of the upper terrace (see charts).
Concentrations
varied
across
the
site.
To
illustrate
this,
the
the
most
complete
collections
(where
areas
were
walked
more
than
once)
were
chosen
for
the
Concentration
Chart
below.
Of
almost
10,000
flints
collected
by
OFARS over the five years fieldwalking, 8622 are represented on the chart.
Milton Cottage (MC)
MC
CR 2011
505
Nethermills West (NMW)
NM 1
CR 2008
3001
NM 2
CR 2011
478
Nethermills East (NME)
NM 3,4
CR 2009
4638
The number of the five higher intensity 10m x 10m squares at each site. The figures refer
to the collections shown in the above chart.

Concentration \ Site

MC

NMW
(NM 1 and 2)

NME
(NM 3 and 4)

Head

>104


2


75 - 104


5


50 - 74


4

6


30 - 49

3

14

16


15 - 29

6

34

62


NMW Much more intense than NME
NME
larger
area
with
possible
less
intense
subsites,
suggested
by
the
‘15-29’
squares
separate
from
the
main
concentration at the SW corner on NM 4.
JBK dig removed ~30, 000 from this area.
The ‘5-14’ squares edged the more intensive areas, with ‘1-4’ squares edgeing and linking the whole scatter.
(Still in preparation)


